

What is R?
As defined by The R Foundation, R is “a language and environment for statistical computing and graphics”. In other words, you can use R to carry on a wide variety of stats, visualize data (in some of the most beautiful ways out there), as well as implement many other purposes extending beyond statistics.
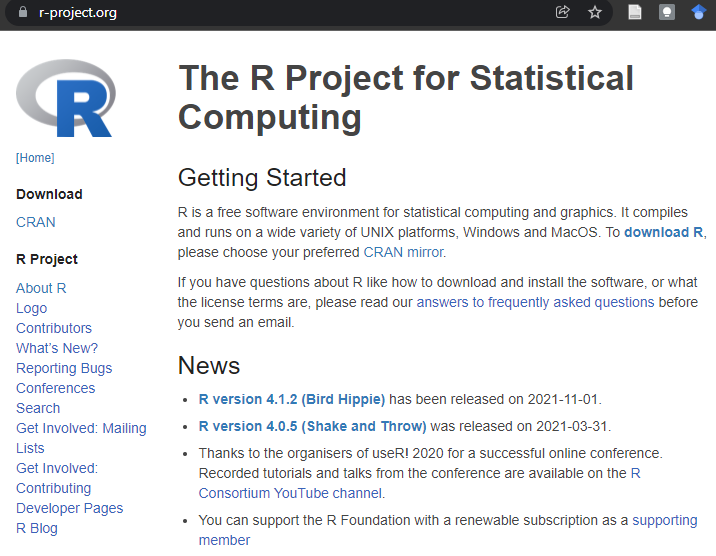
You can get R directly through The R Project website. On their homepage, they’ll have listed the latest available version of R. R is available for all main operating systems (i.e., GNU/Linux, Windows, and macOS).
Why R?
Is R the ultimate statistical software? Heck yeah! Is it the only option to do stats for your research or hobbies? No.
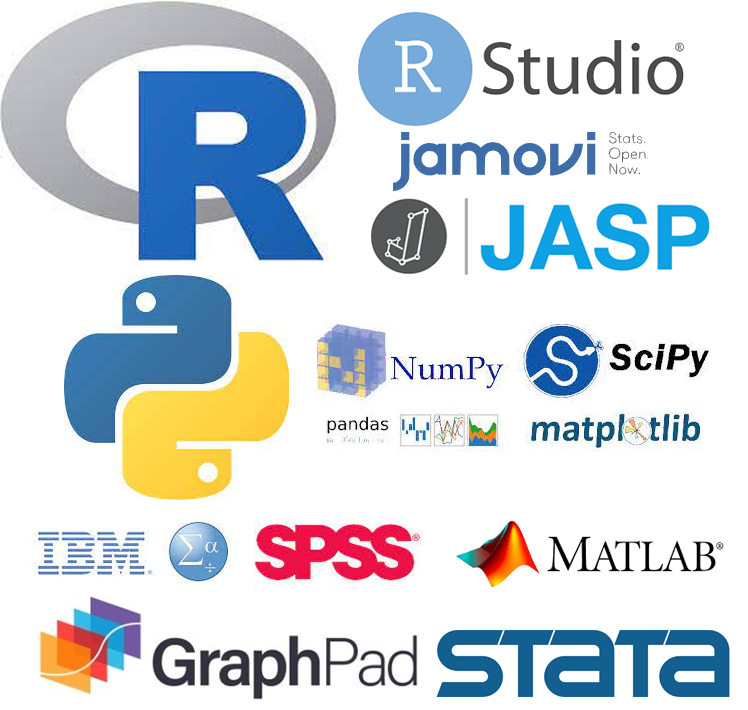
There’s quite a selection of statistical software tools available. I gravitate to R for the following reasons:
- Free & Open Source: Accessible to anyone across the globe without prohibitive licensing fees.
- Extensible: Massive ecosystem of CRAN and Bioconductor packages.
- Statistician-forward: Designed from the ground up for data analysis, modeling, and publication-ready graphics.
- Great Tooling & Community: Incredible IDE integration with Posit/RStudio and an active, welcoming open-science community.
Congratulations! You are now ready to embark on your data science journey!