
I have been rocking my personal website through a GitHub + Netlify setup since its inception in Fall 2018 as I prepared for SfN 2018 in San Diego. During that fall I kept finding Twitter tutorials on building a website and how important an online presence was for academics, especially for early career researchers.
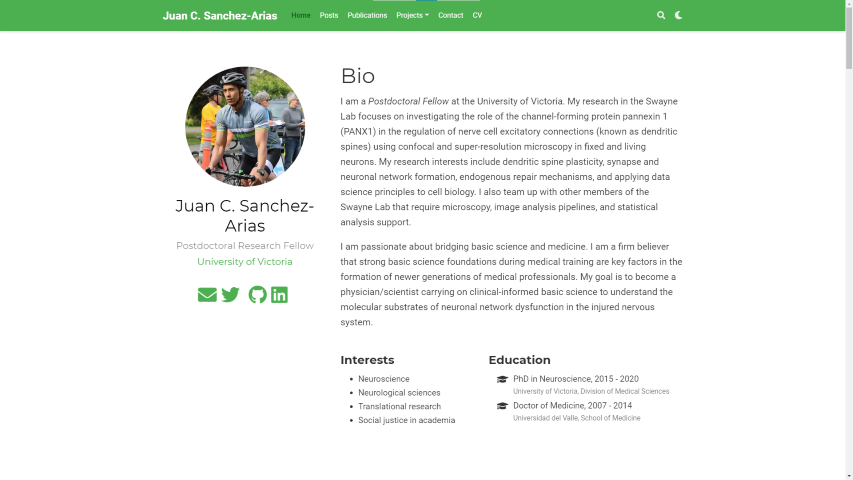
In that moment, I decided not to use RStudio and blogdown as part of the process and made all my editing on VS Code as I was at the peak of my honeymoon with Markdown (a honeymoon that continues until today, I love markdown!) and was just getting a grasp of R and RStudio.
Managing a static website was super fun and I really enjoyed the experience. I gained numerous skills that I always wanted to build up on as someone who has always loved tech, the internet, and programming.
# Circle plot visualization in R
circlize::circos.par("track.height" = 0.4)

data = data.frame(
  factor = sample(seq(1, 24), 1000, replace = TRUE),
  x = rnorm(1000),
  y = runif(1000)
)

circlize::circos.initialize(factors = data$factor, x = data$x)
circlize::circos.trackHist(data$factor, data$x, bg.col = "white", col = "#69b3a2")
I’m hopeful that by having my workflow well integrated with modern web tooling I can continue to advance my data science journey, because let’s face it: we all are data nerds deep inside and love clean visualizations!